Appearance
Dashboard home
Path: /
This page is the overview after you sign in.
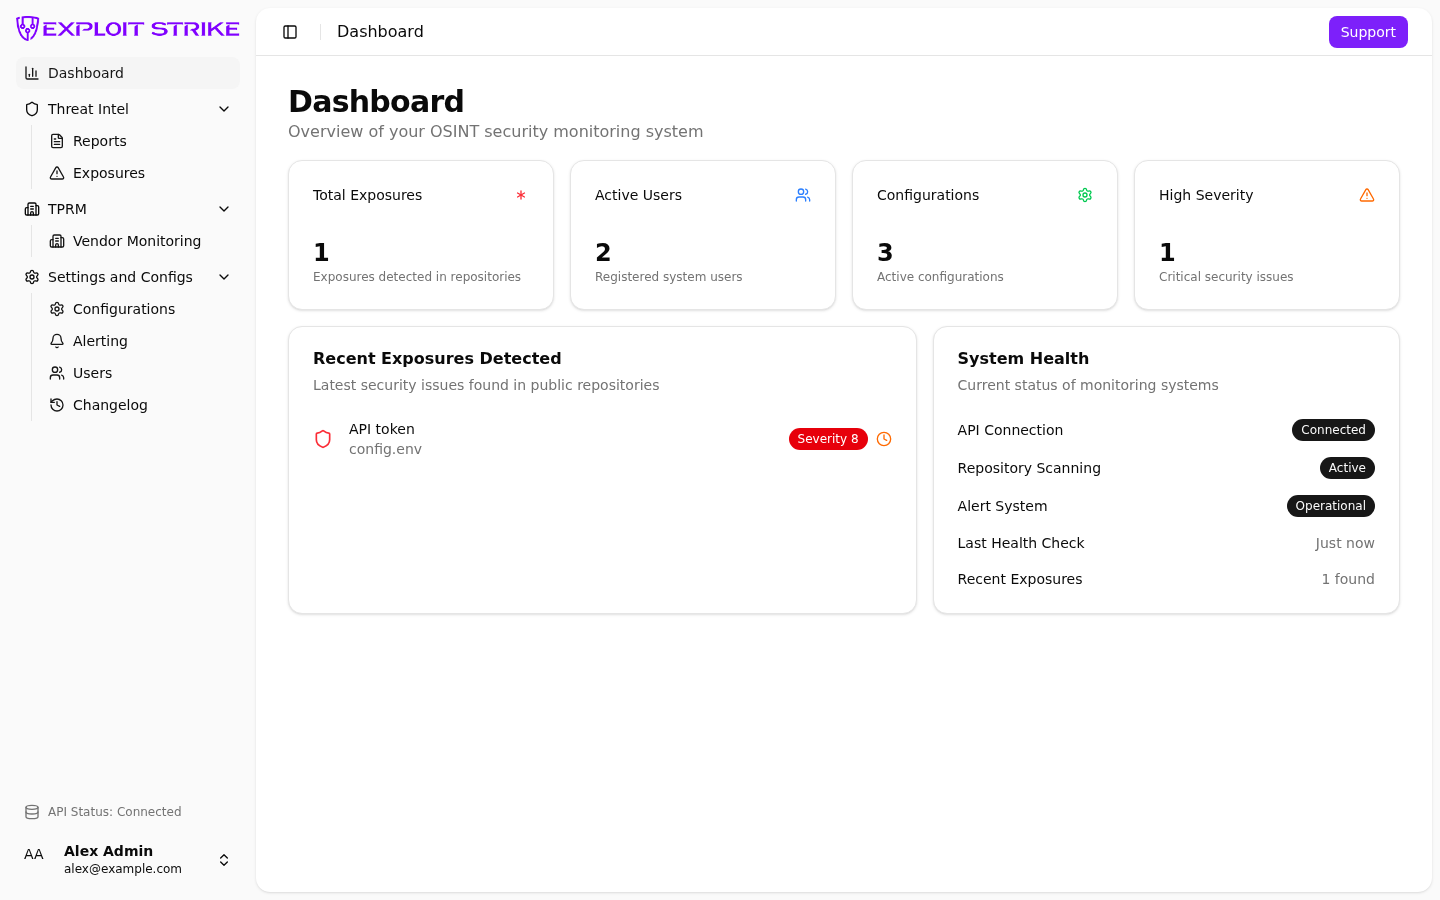
Home cards: Total Exposures, Active Users, Configurations, High Severity. Recent Exposures Detected is on the left. System Health is on the right.
Counts
The top cards show:
| Card | Meaning |
|---|---|
| Total Exposures | Secrets detected in repositories |
| Active Users | Users in this tenant |
| Configurations | Active configuration rows |
| High Severity | Exposures with high severity |
Recent Exposures Detected
This list shows the latest secrets.
Each row shows:
- Secret type
- File reference
- Severity number
- An alerted mark when an alert already went out
- An open mark when the repository is not remediated
If the list is empty, add organization identifiers on Configurations.
Use Add identifiers to open /configs?tab=domain.
System Health
This card shows whether the dashboard can reach its data.
| Row | Meaning |
|---|---|
| API Connection | Connected or Disconnected |
| Repository Scanning | Active when the API is up |
| Alert System | Operational when the API is up |
| Last Health Check | Just now, Checking, or Failed |
| Recent Exposures | Count of rows in the recent list |
The sidebar footer shows the same API status.
Next pages
- Reports — attribution events and ownership
- Exposures — full secret list and status actions
- Configurations — hunt scope
- Investigation playbook — what to do next